Many practices only look at billing numbers once a month, in a report that arrives after the money is already late. A live billing dashboard shows the same numbers every day, and AI adds the part reports never had: what to do next.
The 5 Numbers Every Dashboard Needs
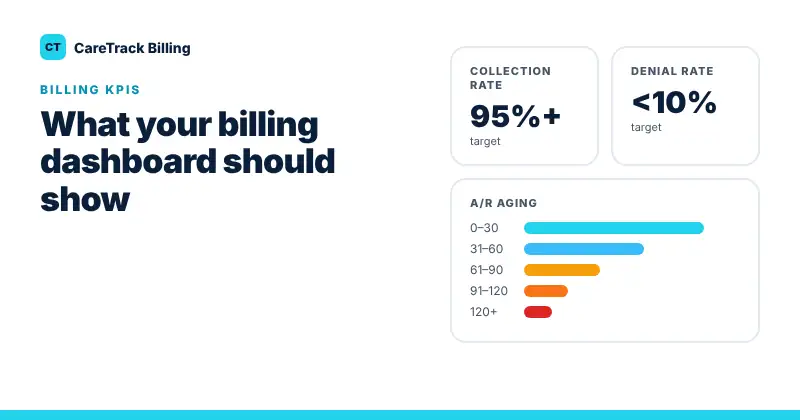
- Collection rate: how much of what you bill you actually collect. Many well-run practices aim for 95% or more of the allowed amount.
- Denial rate: the share of claims denied on first submission. A common target is under 5 to 10%.
- Days in A/R: how long it takes, on average, to get paid after a claim is sent.
- A/R aging: balances by 0–30, 31–60, 61–90, 91–120 and 120+ days.
- Top denial reasons: the few problems behind most of your denials.
What AI Adds
Numbers tell you something is wrong. AI tells you where to start. CareTrack’s dashboard turns your claims data into ranked next actions, for example:
- Claims sitting with a payer for more than 90 days, oldest first
- Denials that are close to the payer’s filing deadline
- The payer holding your largest unpaid balance
- The most common denial reason, so a process fix can stop repeats
Try It With Your Own Numbers
Our free Practice Revenue Snapshot calculates these KPIs from a claims export or a few numbers you type in. It runs in your browser, and nothing is shared unless you choose to send it. Want a full review? Request a free billing audit.